Finding funnels · 2 min read
How to Estimate a Competitor’s Funnel Revenue
Nobody publishes their funnel’s sales. You can still estimate them — with ranges, not fantasy numbers. The method, the inputs, and how wrong it can be.
Every revenue number you see is an estimate
The Meta Ad Library shows no spend for commercial ads. Traffic tools model their numbers. So anyone who tells you exactly what a competitor’s funnel makes is guessing. The honest answer is a range, built from inputs you can explain.
The formula
Value per buyer is the price plus the back end — order bumps, upsells, subscriptions. Each input is a range; the result is a range.
Input 1: traffic — and how accurate it is
Traffic tools estimate. Similarweb says plainly that it’s “an estimations tool” and that its numbers won’t match a site’s own analytics; below about 5,000 monthly visits it shows no data at all. A peer-reviewed comparison of 86 websites found its total visits averaged 19.4% lower than Google Analytics.
Input 2: conversion rate by funnel type
Benchmarks give you a starting band — never a fact about one page:
- Landing pages in general: Unbounce’s 2024 report puts the median conversion rate at 6.6%, across more than 41,000 landing pages. That’s for any conversion — opt-ins included — not purchases.
- Webinars: on ON24’s 2024 B2B data, 57% of registrants became attendees. Consumer webinars can differ.
- Sales: buying converts far lower than opting in. Use a wide band and say so.
Input 3: price — including the back end
The front price is often not where the money is. In a classic free-plus-shipping book funnel, the book barely covers its cost; the profit comes from the upsell right after the order. Walk the whole funnel before you set a value per buyer — see how to analyze a competitor’s funnel.
Cross-check with the ads
- An ad running for months suggests the funnel pays for its traffic.
- Many versions of the same ad suggest more volume.
- Ad pixels on the page confirm it’s built for paid traffic.
A worked example — with ranges
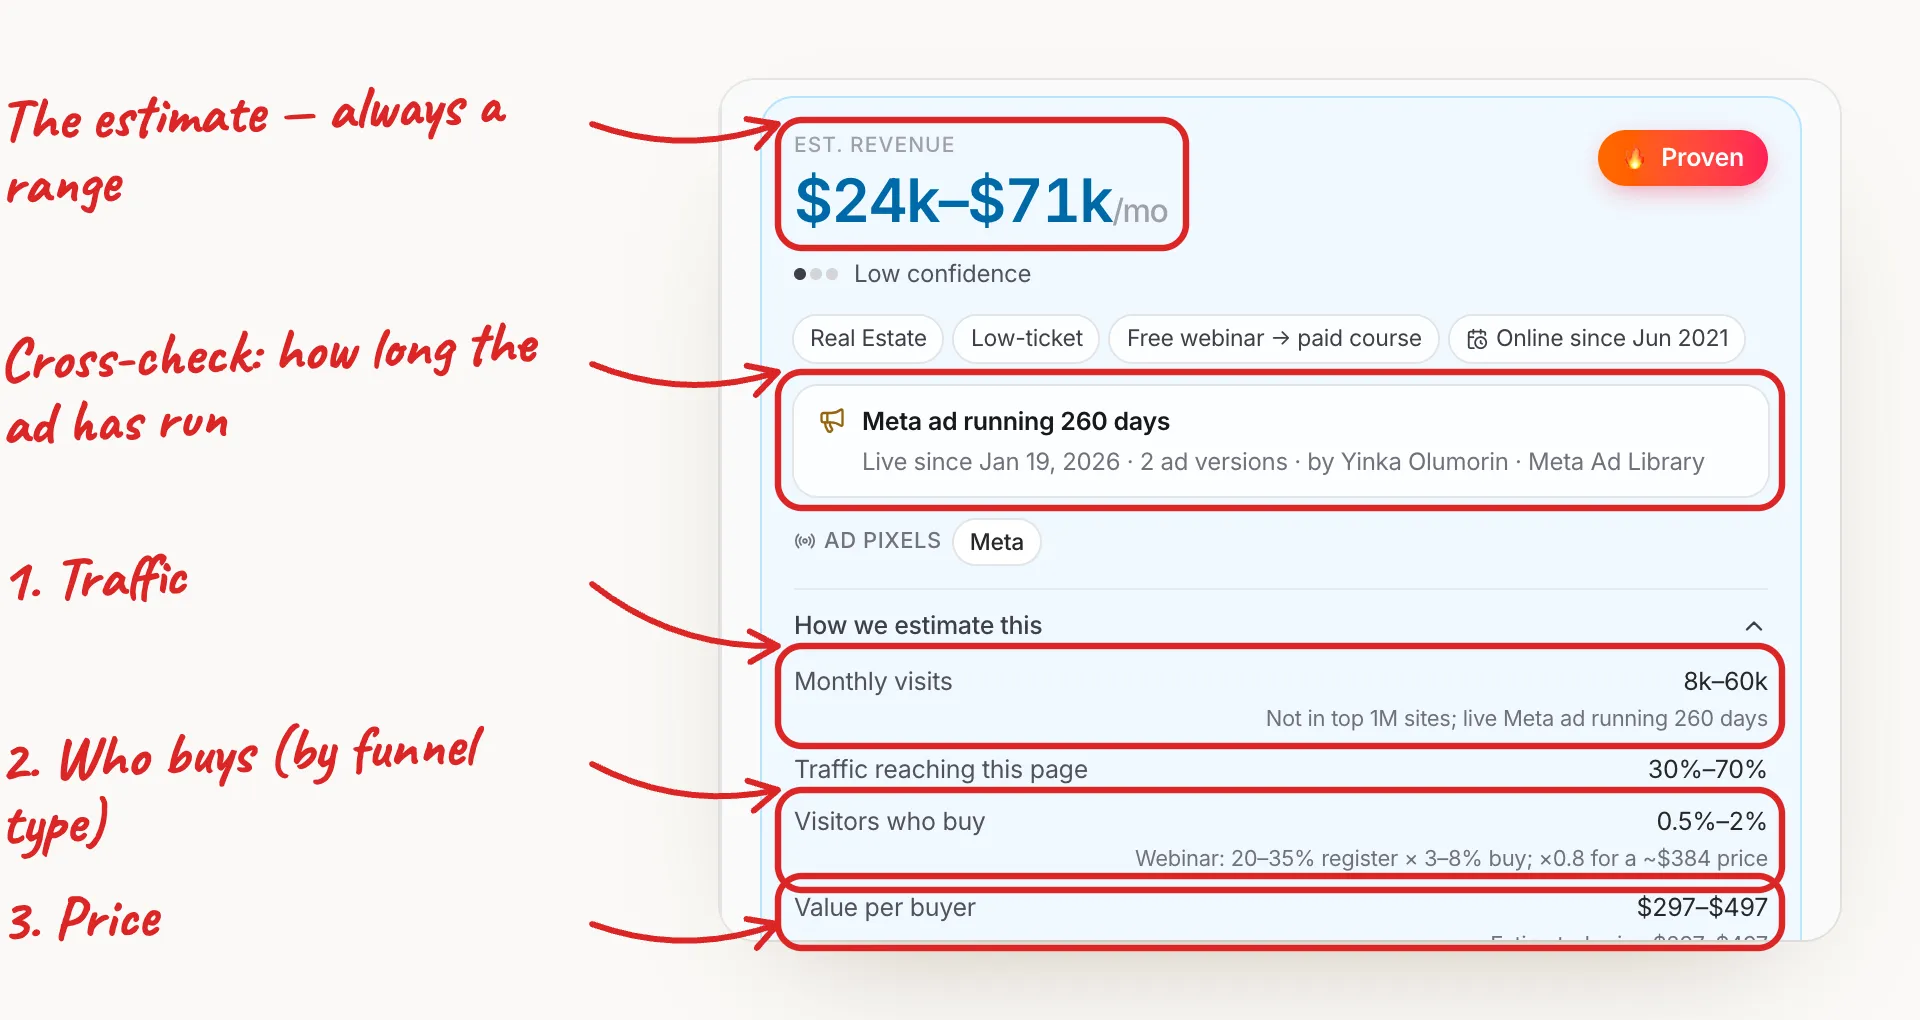
Here’s how Winning Funnels estimated a real webinar funnel running a Meta ad for 260 days:
Tap the image to zoom in
| Input | Range | Why |
|---|---|---|
| Monthly visits | 8k–60k | Not in the top 1M sites, but a Meta ad running 260 days |
| Reaching this page | 30%–70% | A dedicated funnel page |
| Visitors who buy | 0.5%–2% | Webinar funnel, adjusted for the price |
| Value per buyer | $297–$497 | Estimated price of the course sold |
Take the typical value of each range — the geometric middle, because these ranges span several times over (√(8k × 60k) ≈ 22k visits, not the 34k halfway point) — and multiply: 22,000 × 46% × 1% × $384 ≈ $39,000 a month. The estimate shown is $24k–$71k, marked low confidence because traffic data was thin. That honesty is the point.
How Winning Funnels estimates revenue
Every funnel it finds gets this breakdown — visits, share, conversion and price, each with its reason — shown as a range that widens when fewer signals are available. It’s a model, not reported revenue, and it says so on every card.
Questions
How can I find out how much a website makes?
You can’t see its sales, but you can estimate them: monthly visits × share reaching the funnel × share that buy × value per buyer — as a range, with the reasons for each input.
How accurate are traffic tools like Similarweb?
They’re estimates. Similarweb says so itself, and a peer-reviewed study of 86 sites found its total visits about 19% lower than Google Analytics on average.
What conversion rate should I assume?
Use a band for the funnel type, not one number. Unbounce’s median for landing pages is 6.6% — but that includes opt-ins; purchases convert far lower.
Sources
- Meta Business Help Center — About the Meta Ad Library (what each region shows)
- Similarweb Support — How accurate is Similarweb data?
- Jansen, Jung & Salminen — Data quality in website traffic metrics: a comparison of 86 websites (ACM Transactions on the Web, 2020)
- Unbounce — Conversion Benchmark Report (2024)
- MarketingProfs — B2B webinar benchmarks (ON24 2024 data)
- Miles Beckler — Free plus shipping funnels
Checked on October 15, 2026. Platforms change their tools — if something looks different, the official pages above have the latest.
Keep reading
See what the funnels in your niche make
Every funnel comes with a revenue estimate — and the reasoning behind it.